
SolidRed 3.3
Waterfall
Table of contents
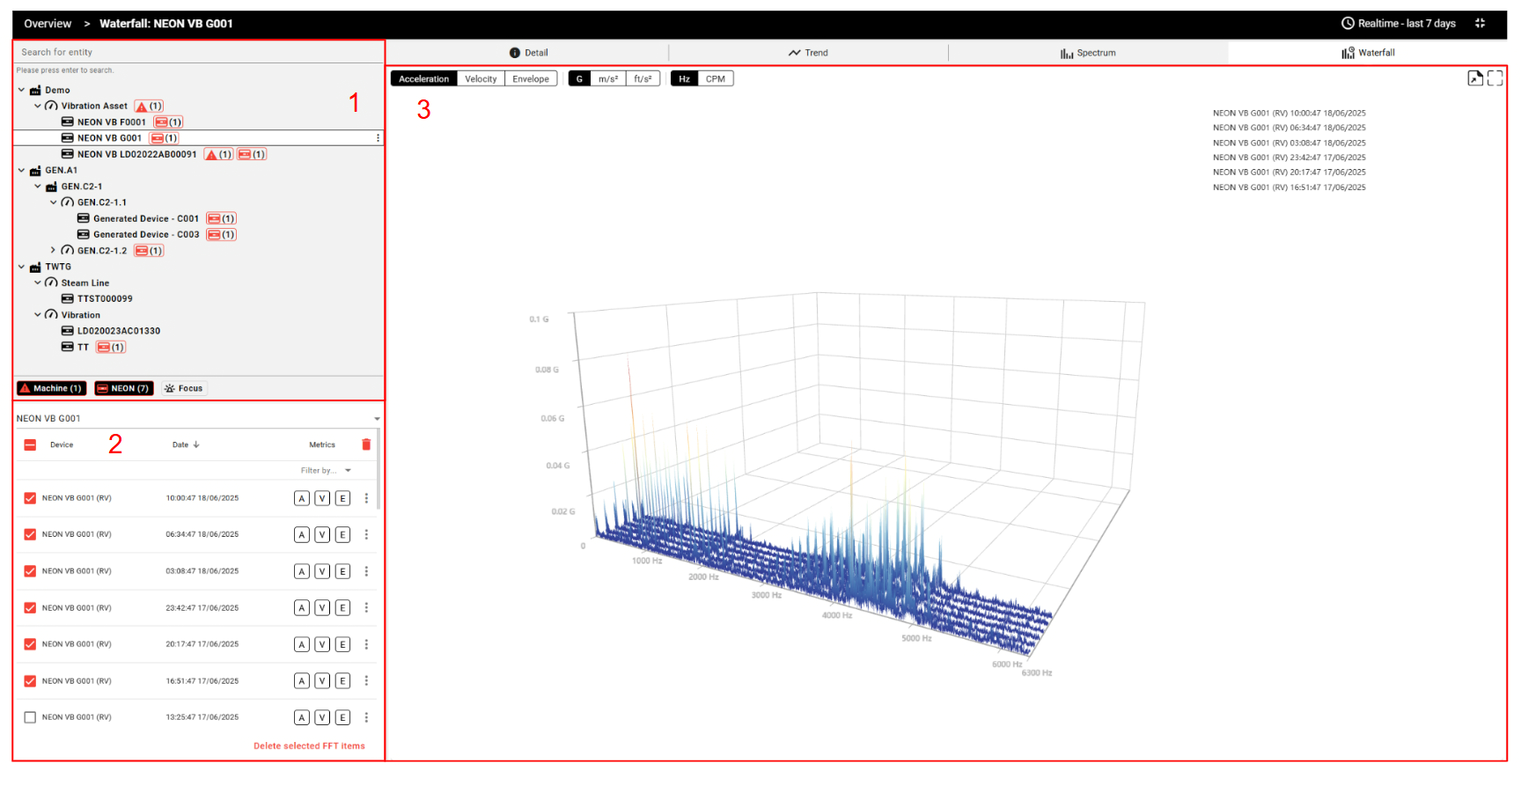
The waterfall view allows the user to view and analyze several FFTs next to each other in a three-dimensional graph. The waterfall view is structured as follows:
Asset tree: where the user can change between the selected entity.
FFTs List: where the FFTs to be displayed in the waterfall graph can be selected.
Waterfall: tridimensional view of the FFTs selected.
User interaction
Video Example
Graph functions
The graph functions are options available on top of the graph. These options allow the user to interact with the data displayed as follows:
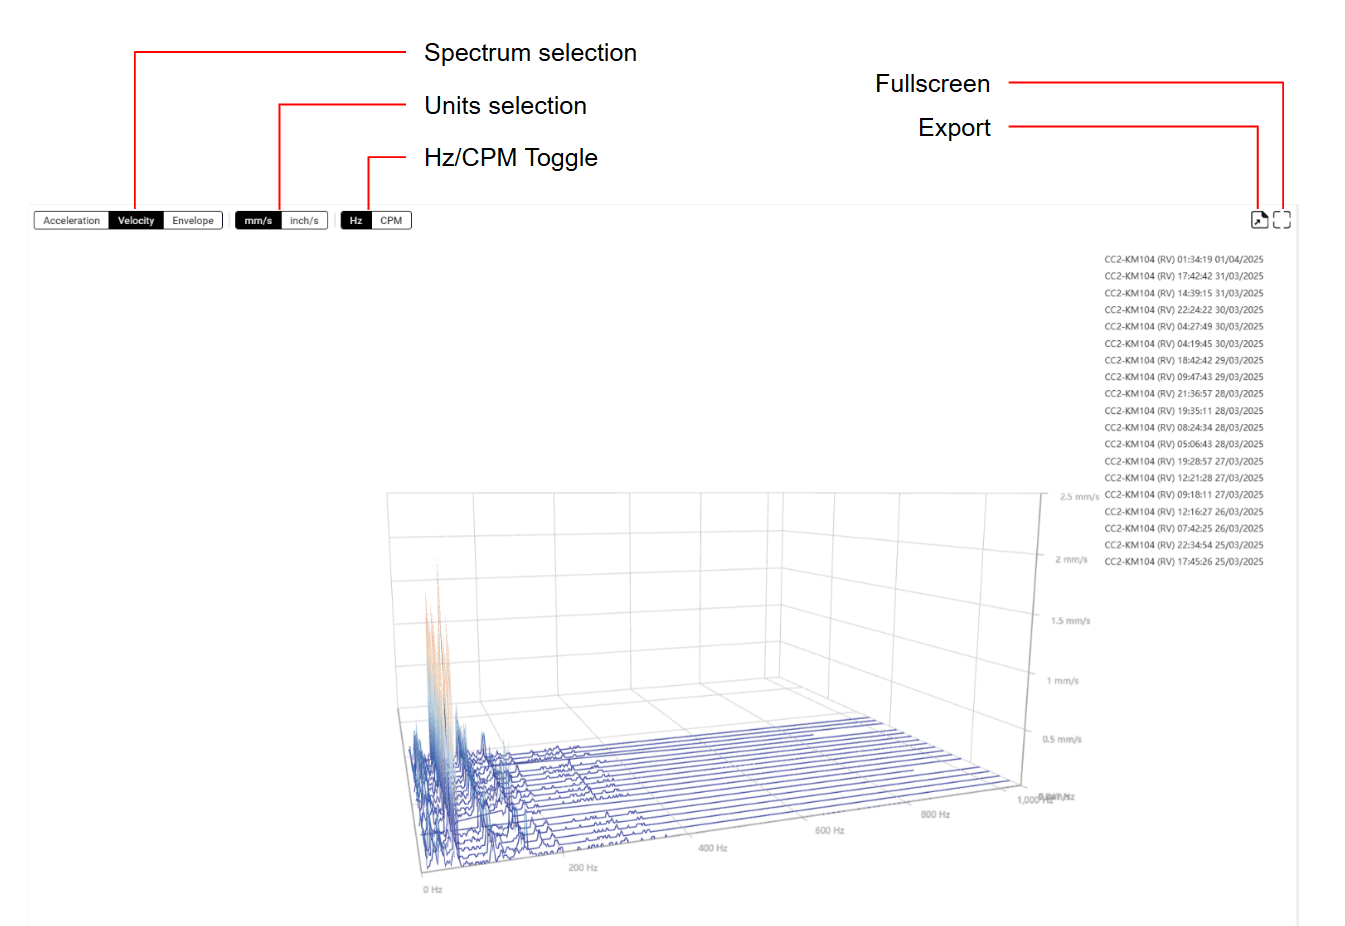
Spectrum selection: select the type of spectrum to visualize (acceleration, velocity, or envelope)
Units selection: change the units used in the graph among the available options. For acceleration and evelope: G, m/s², ft/s²; and for velocity: mm/s and inch/s.
Hz/CPM Toggle: Rescale the horizontal axis to CPM or back to Hz.
Export: download the graph's data in CSV format.
Fullscreen: expands the graph view to fullscreen.
Data points
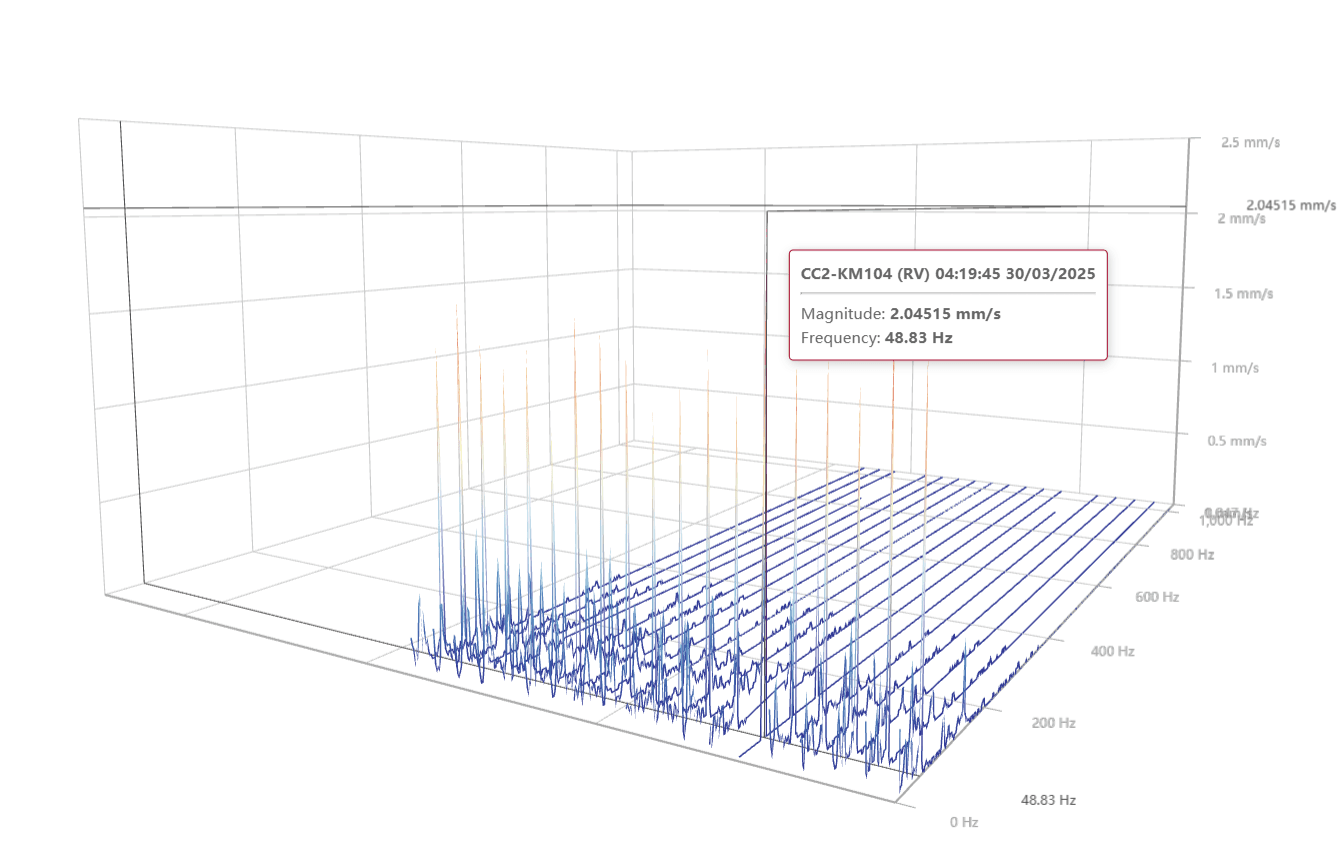
The specific value of a point in the graph can be seen by hovering on the graph. By doing so the values of the X, Y, and Z axes will show. Additionally, helping guides for analysis will be available at such points.