
SolidRed 3.1
Device health
Table of contents
To access the device health dashboard, first click on the vertical ellipsis that appears when hovering over the device in the asset tree. In the displaying sub-menu, select the Health option.
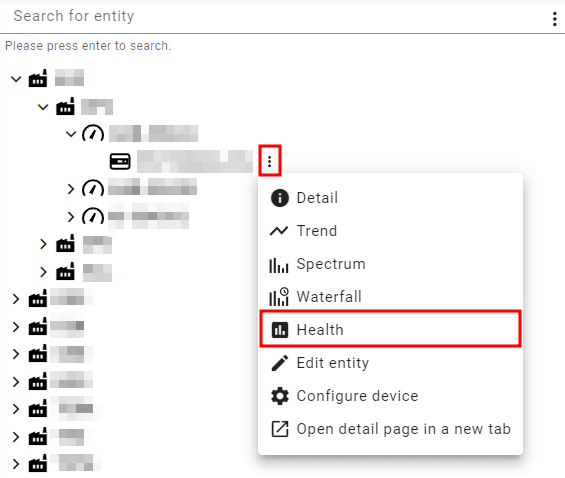
Example to access the device health dashaboard from the asset tree
The device health dashboard comprises the following sections:
Metadata: where the device's name, devEUI, and the date of the last message.
Communication status: indication of the device's current spreading factor and TX counter.
Sensor status: indication of the sensor's pairing and connection.
Transmitter temperature: temperature reported in the device's health messages.
Sensor Temperature: temperature of the probe.
Frame counter graph: indication of the transmitted frames.
Spreading factor graph: a visual representation of the spreading factor over time.
Messages fPort: graph with a representation of the message's fPort over time.
Transmitter and Sensor Boot tables: table with timestamp and reason for booting of the sensor and the transmitter.
Bist graph: self-test Bist result over time.
TX counter graph: TX counter over time.
Battery level graph: battery level over time.
Average RRSSI graph: average RRSSI over time.
An example of the dashboard is presented in the following figure.
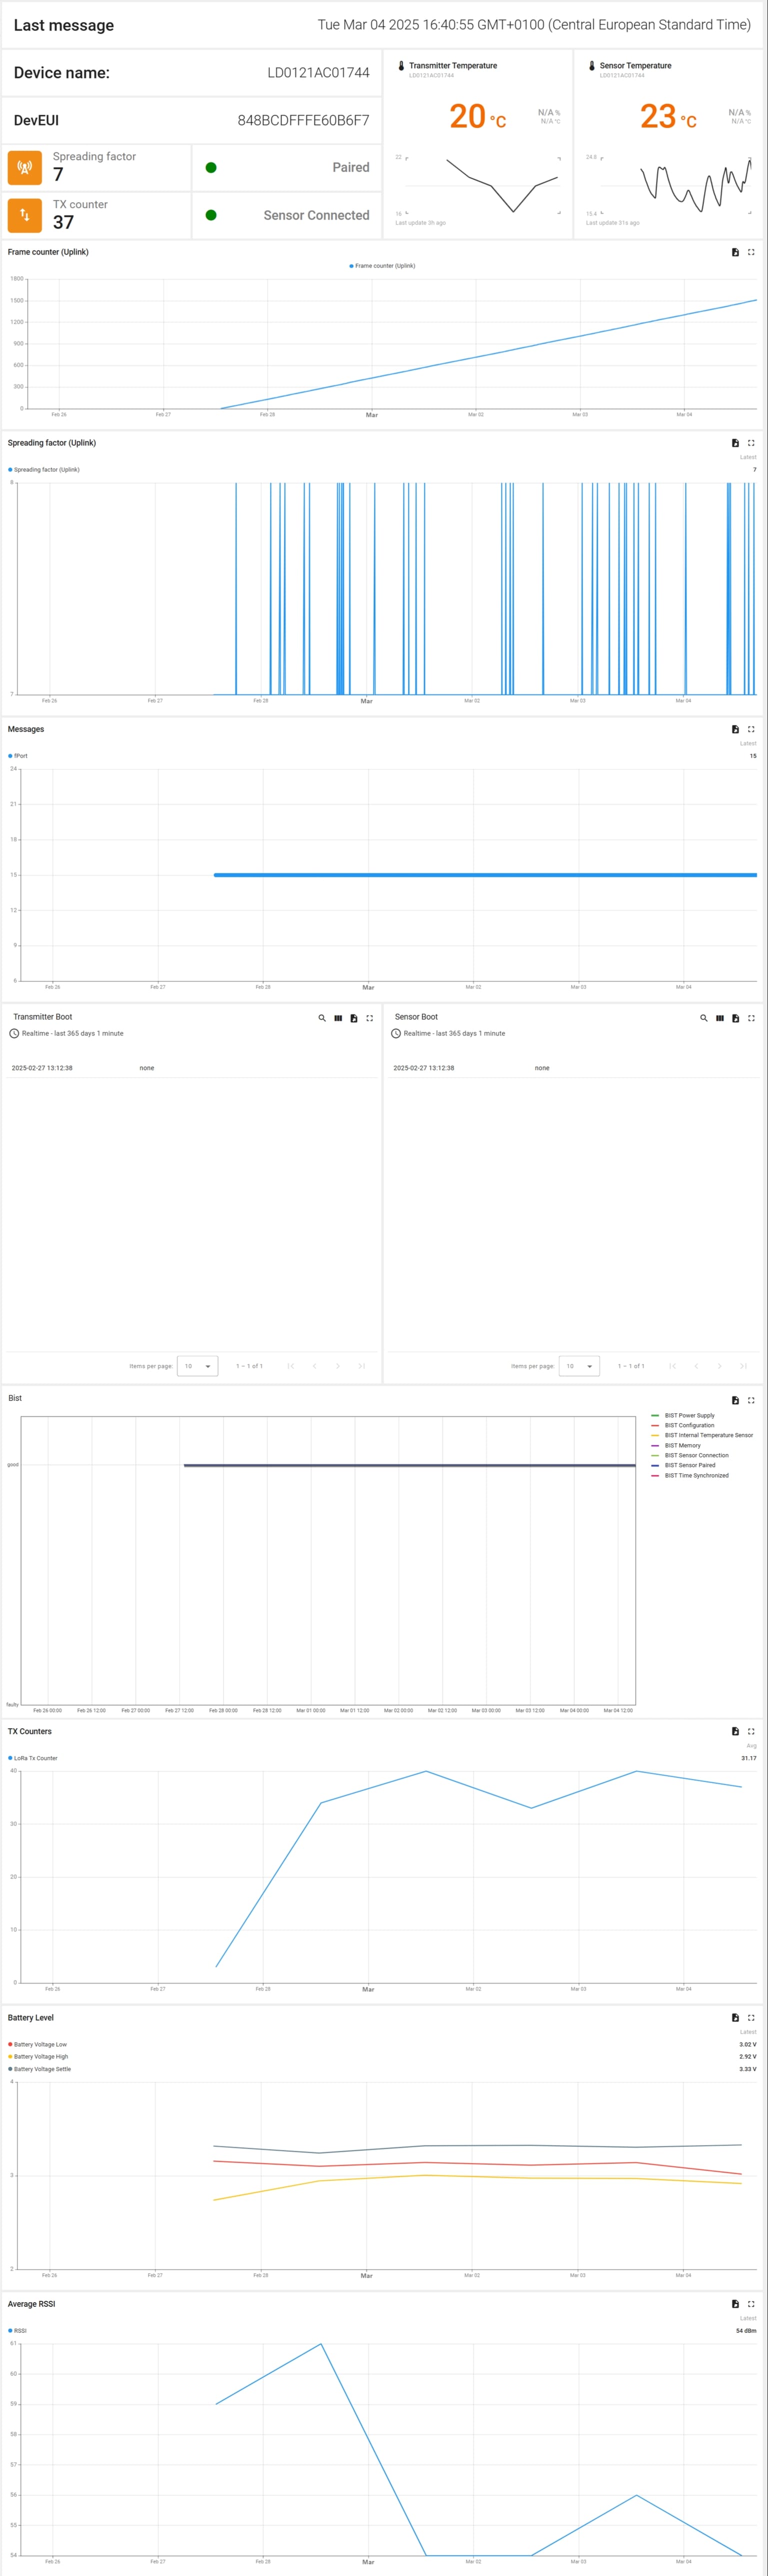
Example of the device health dashboard
User interaction
The user can interact with the graphs and tables in the device health overview as follows:
In a graph, hovering over a point will display the value and timestamp where the mouse is pointing.
In a table or graph, the user can expand to fullscreen or export the data with the icons at the top right corner of the widget.
In a table, search functions and column display options are available in the icons in the top right corner.